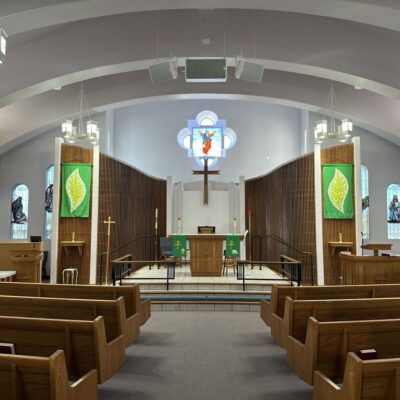
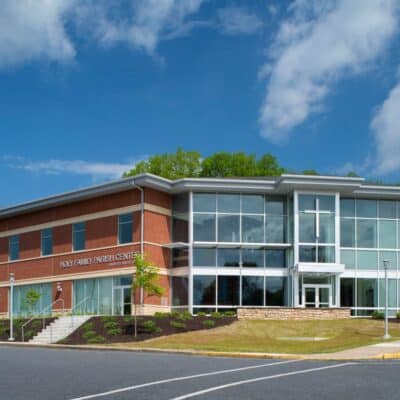
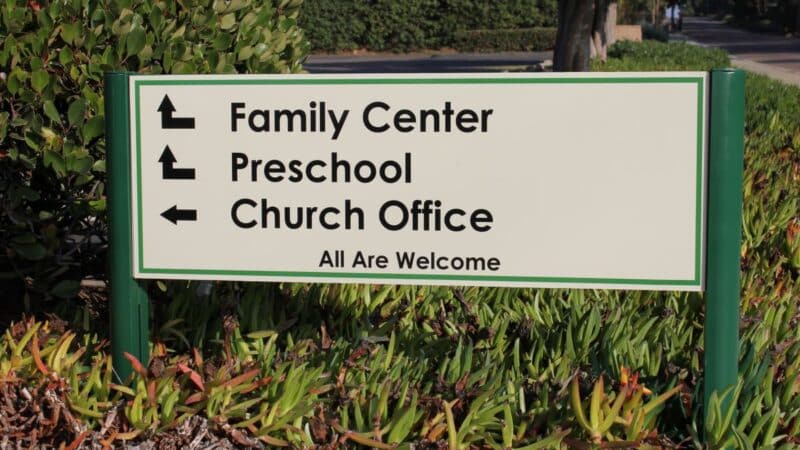
Home About CSP In Every Issue Blog Archives Buyer's Guide Media Guide e-News Subscribe Contact
Check Out The
February 2012 Supplement


Up, Down or Plateau?
By: Lyle E. Schaller

The Consumer Price Index at the end of 2003 was almost exactly 10 times what it was back in 1815. Using 1967 as the reference point, and defining 100 as the index for that year, in 1815, the Consumer Price Index stood at 55. Between 1815 and 1945, the Index went up and down. By 1850, it was down to 28, but, in 1865, it had climbed to 46. In 1900, it was down to 25, but was back up to 60 in 1920. In 1935, it was down to 39.

Those five sentences reflect the fact that adjustments in the American economy created periods of inflation followed by years of deflation. The correlation that stood out historically was war brought a period of inflation and peace brought a period of deflation. One consequence was the Consumer Price Index (1967=100) in 1945 stood at 54, exactly double the 1885 level and slightly higher than the 1800 figure of 51.

After World War II, governmental policies called for inflation, not deflation, to be the preferred way for making adjustments in the national economy.

By the end of 2002, the Consumer Price Index had climbed to 540, and, at the end of 2004, it was up to 567. An annual inflationary rate of 3 percent for 2005 and 2006 would bring it above 600 by the end of 2006.

It must be added that the median per capita personal income in the United States, after allowing for inflation, more than tripled between 1945 and 2005. Thus, if the goal is to offset inflation and also keep up with the increase in the median personal per capita income, the congregation that provided $1,200 a year for their pastor’s compensation in 1945, including cash salary and fringe benefits such as pension payments, is expected to pay in the range of $40,000 to $60,000 in 2006 for total compensation (cash salary, housing, utilities, pension payments, health insurance, etc.). One consequence is thousands of small churches that once enjoyed the services of a full-time resident pastor have been priced out of the ministerial marketplace. The rising cost of fringe benefits, such as health insurance and housing, have forced many of these small congregations to turn to other alternatives in staffing.

From Continuity to Discontinuity
A parallel trend can be seen all across the American economy. The number of very large farms has increased during the past six decades, as has the number of fewer than 30 acres. The number of midsized farms of 80 to 360 acres has decreased. Likewise, the number of large medical clinics has increased, while the number of physicians in solo practice has plummeted. The number of public high schools with an enrollment over 1,000, the number of supermarkets, the number of very large new car dealers, the number of large universities, and the number of large hospitals also have increased. The number of mid-

sized institutions has dropped since the end of World War II, but there has been an increase in the number of small institutions that fill a specialized niche. That long list includes small private elementary schools, small owner-operated gift stores, specialized medical clinics with three or four physicians on the staff, and stores that specialize in packaging and mailing small items.

If we narrow the focus to American Protestantism, a parallel trend can be seen. Give or take 20 percent, for many decades, thousands of smaller congregations remained on a plateau in size for decades. If the current minister turned out to be a good match, church attendance climbed by 10 to 20 percent. If a subsequent pastor was not a good match, attendance dropped perhaps 10 to 20 percent. Stability was a common pattern. This pattern is revealed repeatedly in the histories of individual congregations.

Inflation became a permanent trend in the American economy after 1945. Some periods were marked by a relatively low rate of 1 or 2 or 3 percent annually, while other years brought an annual inflationary rate of 8 percent or more. The turbulent 1960s also brought the beginning of the end of the plateau as an option for tens of thousands of congregations in American Protestantism.

Seven Generalizations
The first generalization that emerges after looking back over nearly five centuries of American church history is the larger the size of the congregation in 1900 or 1945 or 1965, the more likely it has not continued on a plateau in size. That line on the graph reporting the annual average worship attendance usually has either gone up or down, often by 50 percent or more.

A second generalization relates to the suburbanization trend of the second half of the 20th century. This was accompanied by a rapid drop in size in hundreds of very large central city congregations. Old First Church Downtown is a common example. In one congregation, the annual average worship attendance dropped from 1,470 in 1955 to 535 in 1978 to less than 275 by the end of the 20th century. That was one facet of a larger pattern.

A third basic generalization is the longer an urban congregation has been gathering for the corporate worship of God at the same location, the more likely that the average worship attendance was lower last year than it was in 1955.

A fourth generalization parallels that rise in the Consumer Price Index since 1945. The ceiling keeps being raised. In 1956, the Consumer Price Index reached a new high of 81. What would have been the response of economists if someone had predicted that the Index would triple during the next 50 years? Scorn? Laughter? History reports that prediction was in error. In 2005, that Index stood at more than seven times the 1956 level.
As recently as the 1960s, with only a few exceptions, the truly big congregations in

American Protestantism averaged between 800 and 4,000 at worship. Today, some observers contend an average worship attendance of 2,000 is the minimum size to qualify as a megachurch. The really large congregations report their weekend worship attendance runs between 10,000 and 30,000. The ceiling has been raised on the size of institutions all across the American landscape, including grocery stories, Protestant congregations, motion picture theaters, profit-driven corporations, universities, medical clinics and public school districts.

A fifth generalization is based on the experience of those mid-sized congregations that during the third quarter of the 20th century appeared to plateau in size with an average worship attendance of 100 to 200. Like the Consumer Price Index between 1800 and 1945, many of them experienced periods of modest increases or decreases, but give or take 30 percent, they usually hovered between 120 and 160 at worship. Beginning in the 1960s, however, a majority either grew up out of that size bracket of 100 to 200 at worship or dropped down out of it. Other congregations dropped down into that size bracket, and a smaller number grew up into it, but the total number dropped substantially. That size bracket became a type marked by instability, not the stability of the 1950s.

The basic trend all across American Protestantism has been an increase in the number of congregations (exclusive of that growing number of small house churches) that average fewer than 50 at worship, a substantial decrease in the number averaging 100 to 200 at worship, and a substantial increase in the number averaging more than 800 at worship.
The increase in the competition among the churches for future constituents has meant that it is increasingly difficult for the mid-sized congregation to remain on a plateau for decade after decade. As congregational leaders begin the process of designing a five-year ministry plan, one of the critical questions is, "Should we plan to grow in numbers or decrease in size?" Either goal usually is easier to attain than the dream of continuing on a plateau in size.

A sixth generalization focuses on a more subjective and subtle parallel. That is summarized by the word quality. The ballpoint pen that costs a quarter today is a higher-quality writing instrument than the ballpoint pen that sold for $5 in 1945. The personal computer that costs $400 today is a far superior piece of electronic equipment compared to the computer that cost $1,500 in 1985. The television set that sells for $200 today is a far better value than the set that cost $800 in 1955. Likewise, the parishioner who places a check for $30 in the offering plate next Sunday (the equivalent, after allowing for inflation of one $5 bill in 1967) not only is contributing a smaller percentage of the family income than $5 represented in 1967, but also may be benefiting from a higher-quality ministry. Since quality costs money, that usually means the current competition among American Protestant congregations to reach, attract, serve, assimilate, nurture, challenge and equip for ministry potential future constituents is more likely to be decided by quality, relevance and choices rather than by costs.

Finally, the last change that often is overlooked is that as recently as the 1950s, Christian congregations all across America were attracting parishioners with a producer’s agenda. Each congregation decided what it would offer and when that would be offered. That was a culture and an economy that was compatible with the producers of most goods and services being able to decide what they would offer to the general public. Examples included commercial airlines, financial institutions, the five and dime variety stores, liberal arts colleges, the designers of motor vehicles, Christian congregations, grocery stores and hospitals.

A half century later, consumerism has undermined that producer-driven model. The generations born after World War II expect the producers of goods and services to be sensitive and responsive to the expectations of consumers. This rise of consumerism has turned out to be one of the most divisive issues in contemporary American Christianity. Examples can be found in schedules, music, sermon content, the availability of convenient and safe off-street parking, and the switch from teaching to learning in what traditionally has been called Christian education.

For some, the most disturbing consequence can be seen in the ministries with women. The old pattern called for organizing groups of women around the study of missions, Bible study, prayer, fellowship and raising money for world missions. The new pattern calls for organizing groups around the concerns women bring to church.

Moving up off the plateau in size and/or reaching younger generations usually requires accommodating change. Resisting change usually is consistent with the decision to grow older in the age of the membership and smaller in numbers.

Do any of these seven generalizations reflect what has been happening in your congregation?

For more than four decades, Lyle E. Schaller has served as a parish consultant to hundreds of congregations and scores of denominational agencies. His recent books include From Geography to Affinity, The Ice Cube Is Melting, and A Mainline Turnaround.

Copyright © 2006 Lyle Schaller


Voice Broadcasting

©Copyright 2012 Religious Product News
Religious Product News